Metric Definitions
Agreeing on one definition of active customers
Set the customer unit, qualifying activity, time window and identity rule, then resolve disputed cases before sharing an active-customer count.

Archive
Metric Definitions
Set the customer unit, qualifying activity, time window and identity rule, then resolve disputed cases before sharing an active-customer count.
BI Architecture
Rebuild case timelines, distinguish recorded work from elapsed gaps, compare process routes and investigate delays without assuming their cause.
Reporting Operations
Define a business forecast, compare methods with a simple benchmark, assess earlier predictions and communicate uncertainty before using the result.
Data Governance
Define and check row-level BI access using business entitlements, representative users and the right platform roles.
Reporting Operations
Assign a business owner and technical contact to a recurring report, then record the decisions and handover each role requires.
Data Governance
A data quality alert can identify a fault and still achieve little if no one owns the next step.
Data Modelling
Recreate historical forecast issue dates, prevent future-data leakage, compare errors at the right horizon and interpret the result’s limits.
Data Governance
Set owners, access boundaries and review triggers for BI datasets, metrics and exports, with Australian privacy considerations.
Reporting Operations
Keep BI reports useful with clear owners, evidence of decision use, timely reviews and controlled retirement.
Data Modelling
Define reporting grain, facts, dimensions, dates, measures and changing attributes in a BI model that produces explainable figures.
Reporting Operations
Use BI to review operational demand, completed work, backlog, delays and capacity, with clear definitions and limits for each decision.
BI Architecture
Measure BI delays and recurring costs, locate the responsible workload, and check accuracy and freshness before accepting a change.
Dashboard Design
Turn incoming work and backlog goals into effort, compare them with usable hours and slots, and show the assumptions behind a capacity gap.
Data Modelling
Set consistent reporting dates, weeks, financial periods and date roles across BI reports, with practical checks for boundaries and incomplete data.
BI Architecture
Plan BI architecture around decisions, source data, shared measures, reporting, access and change without overbuilding the first solution.
Metric Definitions
Define business metrics by purpose, population, calculation, period and owner so teams can reproduce and interpret reporting figures.
Reporting Operations
Verify BI exports and embedded reports with the users, permissions, file contents and authentication your delivery route requires.
Data Governance
When a report total differs from its source, comparing two numbers is only the beginning.
BI Architecture
Compare mean, latest-value, seasonal and drift baselines, then decide whether a more complex forecasting model adds useful value.
Metric Definitions
Select dashboard indicators by the decisions leaders actually make.
Metric Definitions
Choose a first BI question with a real decision, clear owner, workable data and an answer the business can check.
Data Modelling
Build a testable warehouse brief from report queries, refresh times, history, concurrent use and acceptance checks.
BI Architecture
Compare operational databases and data warehouses by query workload, history, freshness and application impact before moving reports.
Data Modelling
Compare operational sites using aligned definitions, useful denominators and case-mix context while keeping raw results and uncertainty visible.
Reporting Operations
Compare batch and near-real-time paths by decision timing, report completeness, recovery and visible data delay.
Dashboard Design
Compare who builds reports, owns shared measures and approves distribution when selecting a BI reporting model.
Dashboard Design
See where a dashboard request includes data, definitions and ownership, then write a clear scope for the work.
BI Architecture
Plan how source changes reach BI reports, keep figures traceable and define when a reporting period is complete.
Data Governance
Data quality checks turn a vague concern about “bad data” into a small set of assertions that a reporting team can run and act on.
BI Architecture
Decide when reporting needs a data warehouse, what analytical storage must serve, and which workload and cost questions to check first.
Data Modelling
Use meaning, reuse, access and change impact to decide which reports should share a data model.
Metric Definitions
Specify a BI report's source cutoff, ready-by time, completeness rule and reader-facing status when data is late.
Data Modelling
Define what each BI table row represents, identify valid keys and distinguish additive amounts from balances and ratios before building reports.
Data Governance
Set practical criteria for report creators, distinguish Build from edit and publishing rights, and review access as roles change.
Dashboard Design
An exception tile should tell a leader what changed, whether the data is trustworthy and who is investigating.
Data Governance
Duplicate records can inflate a sum without looking obviously wrong in a chart.
Dashboard Design
Reproduce a slow dashboard action, locate the delay, and test whether a targeted fix meets the reader’s need before considering replacement.
Metric Definitions
Separate what the business expects from what it wants to achieve, and use the gap to plan action without changing the forecast to match the target.
Data Modelling
Record currency pair, rate source, date, direction and missing-rate treatment so converted BI figures can be reproduced and reconciled.
Metric Definitions
Define both sides of a KPI ratio, align their population and period, and record how the rate behaves under filters and missing data.
Reporting Operations
Build a warehouse cost estimate from stored data, queries, running compute and related services, with billing-model caveats.
BI Architecture
Build a fair BI software trial with one data snapshot, approved figures, matching user tasks and recorded configuration differences.
Dashboard Design
An executive dashboard should make a small number of decisions easier, not display everything the organisation can measure.
Dashboard Design
Explain prediction intervals, scenarios and planning allowances in plain language, with assumptions and decisions beside the range.
Dashboard Design
Structure finance BI views around approved figures, comparable periods, explainable variances and visible reporting limits.
Data Modelling
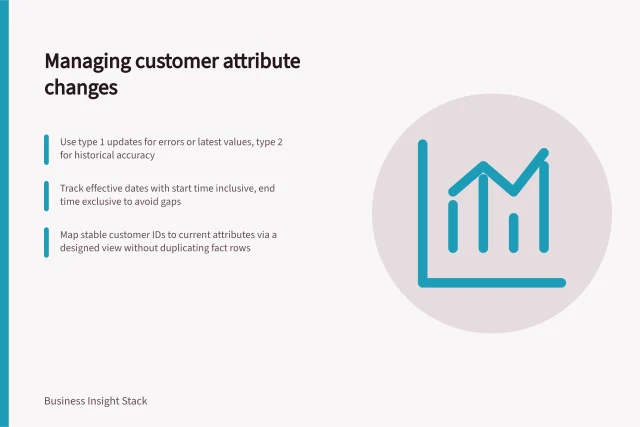
Choose when to overwrite customer details, retain dated versions or show a current grouping, and check how each choice affects historical BI reports.
Reporting Operations
Distinguish absent source deliveries from genuine zero activity and decide how a BI report should show incomplete data.
Metric Definitions
Record metric versions, effective dates, history treatment and affected reports so changes in BI figures remain explainable.
Metric Definitions
Define open work and completed work, reconcile queue movements, and add age and case mix without confusing status events with cases.
Dashboard Design
Connect dashboard activity with decision records and reader feedback while accounting for the limits of usage metrics.
Data Governance
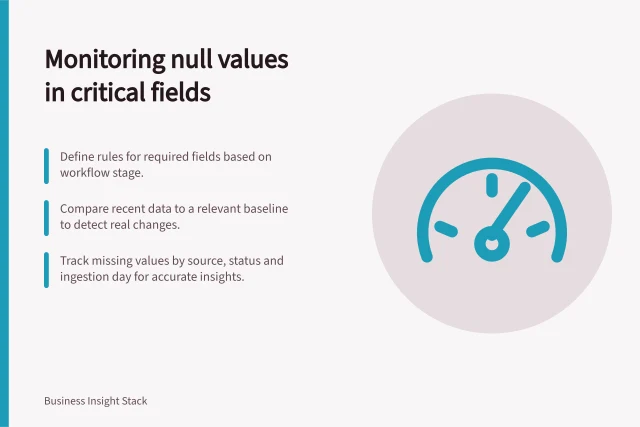
A null value means a field has no recorded value; it does not always mean a process failed.
Reporting Operations
Compare BI entitlements and scheduled jobs with actual tasks, telemetry coverage and dependencies before changing access or schedules.
Metric Definitions
Plan a BI migration using versioned metric definitions, fixed reference data and explicit checks for accuracy, access, freshness and performance.
Data Modelling
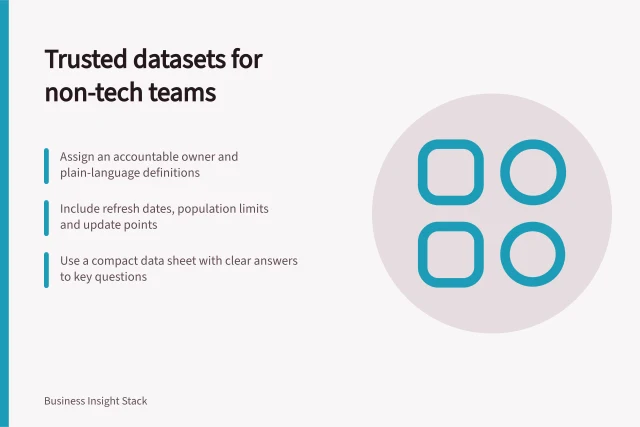
Make reusable datasets understandable with approved measures, visible limits, ownership and a practical first-user check.
Reporting Operations
Find repeated report queries, reduce unnecessary reads and runs, and verify the result under the relevant billing model.
Dashboard Design
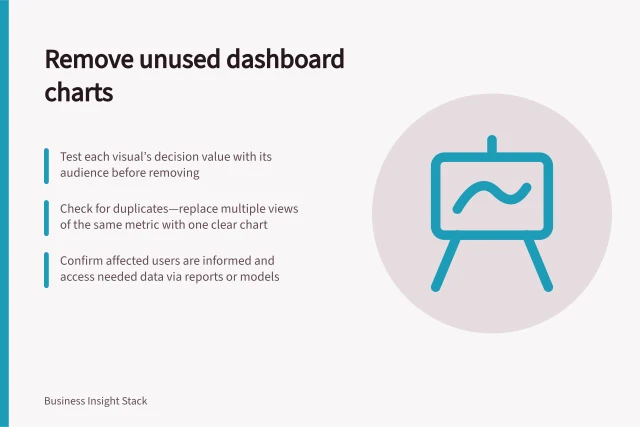
Removing a chart can make an executive dashboard more useful.
Metric Definitions
Define segment membership, margin costs and shared-cost treatment before comparing segment results in a finance BI report.
Reporting Operations
Investigate an unexplained report's meaning, users and dependencies before documenting, replacing or retiring it.
Reporting Operations
Set a release trigger, check figures and access, and record a version-specific decision before a self-service report reaches more people.
Data Governance
Review detailed BI exports by purpose, permission route and effective access, then verify revoked or expired grants.
Reporting Operations
Schedule affected report reviews after restructures, departures and audience changes before the next important use.
Metric Definitions
Choose BI software against your data, authors, viewers and delivery needs. Build a shortlist and compare candidates with a defined trial.
Dashboard Design
Learn how to give teams room to create reports while maintaining dependable datasets, useful training and proportionate review.
Data Governance
Design management reports around useful measures while keeping identifying records in a separately controlled data path.
Metric Definitions
Classify recognised revenue under an approved recurring and one-off rule, keep ambiguous lines visible and reconcile the split to total revenue.
Metric Definitions
Define recognised revenue and customer cash receipts separately, show their different dates and explain timing differences in a dashboard.
Dashboard Design
A target helps only when the viewer can tell what it represents and how certain the comparison is.
Data Modelling
Check extraction, mappings, delivered fields and report figures after a source schema changes.
Reporting Operations
Find where a BI revenue difference begins by comparing an approved finance amount and contributing records at each transformation boundary.
Metric Definitions
Use an order-and-line exercise to teach reporting grain, join checks and when to refer a calculation to the dataset owner.