Dashboard Design
Part of Executive dashboard design
Showing targets without hiding uncertainty
A target helps only when the viewer can tell what it represents and how certain the comparison is.
A target comparison is useful only when viewers can tell what the target represents and how certain the comparison is. Show actual performance beside the target, with the period, metric definition and a clear label when the target is provisional or the data is incomplete.
State the target's basis
State whether the target is a contractual commitment, a budget assumption, last year’s result or a new estimate. Show its basis, period and metric definition beside the comparison, with actual performance alongside it.
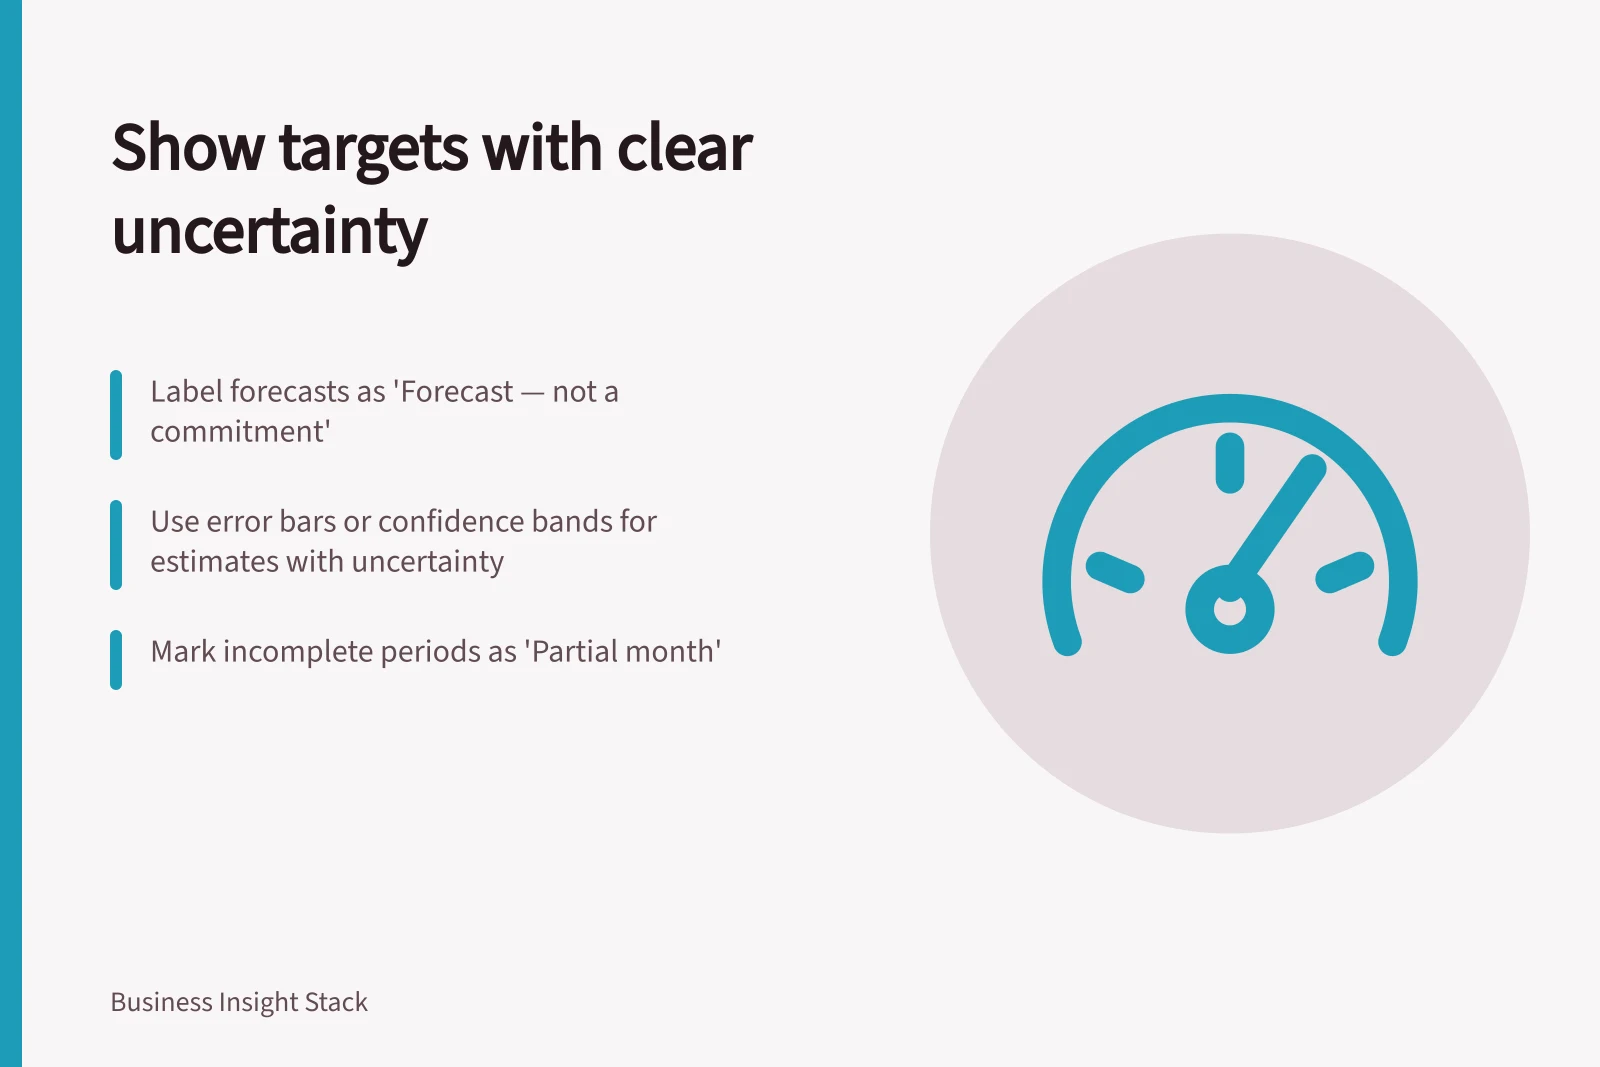
If a number is a forecast, label it as a forecast rather than a commitment. A forecast is an evidence-based view of where performance is heading if observed patterns continue; a tile label could read “Forecast — not a commitment”.
For an estimate with uncertainty, use error bars or a confidence band to show it. These techniques are precise and space-efficient, but may need a short explanation because readers can require expert knowledge to interpret them correctly.
Mark incomplete periods clearly: for example, label a partial month “Partial month” rather than letting it appear comparable with a full-month result. A partial result should not be presented as final.
For a percentage based on a small sample, show the count beside the percentage. If a source feed is late, label the affected tile “Data feed late” rather than colouring the result green or red as if it were final.
If a target changes mid-year, retain the earlier value and explain the revision so viewers can see what changed. The Setting Performance Targets: Getting Started Guide advises against changing targets during the performance period and says to revisit them next year with new performance data.
Microsoft Learn’s Tips for designing a great Power BI dashboard recommends providing context for visualisations and keeping essential information on one screen. Keep the target basis and uncertainty label close to the comparison, with detailed assumptions in the underlying report.
Before a meeting, ask someone unfamiliar with the metric what conclusion they draw. If they mistake a forecast for a commitment or a partial result for a final one, change the label or visual treatment.
Key Context for Target Interpretation
- Target Basis
- Forecast based on historical trends
- Metric Definition
- Monthly revenue from Australian SaaS subscriptions
- Data Status
- Data feed late – not final