Data Governance
Part of Data quality checks
Checking totals between a source and its BI model
When a report total differs from its source, comparing two numbers is only the beginning.
When a report total differs from its source, comparing two numbers is only the beginning. The totals must describe the same population at the same point in time and use the same calculation. Otherwise a legitimate modelling choice or refresh delay looks like a data defect.
Align the comparison
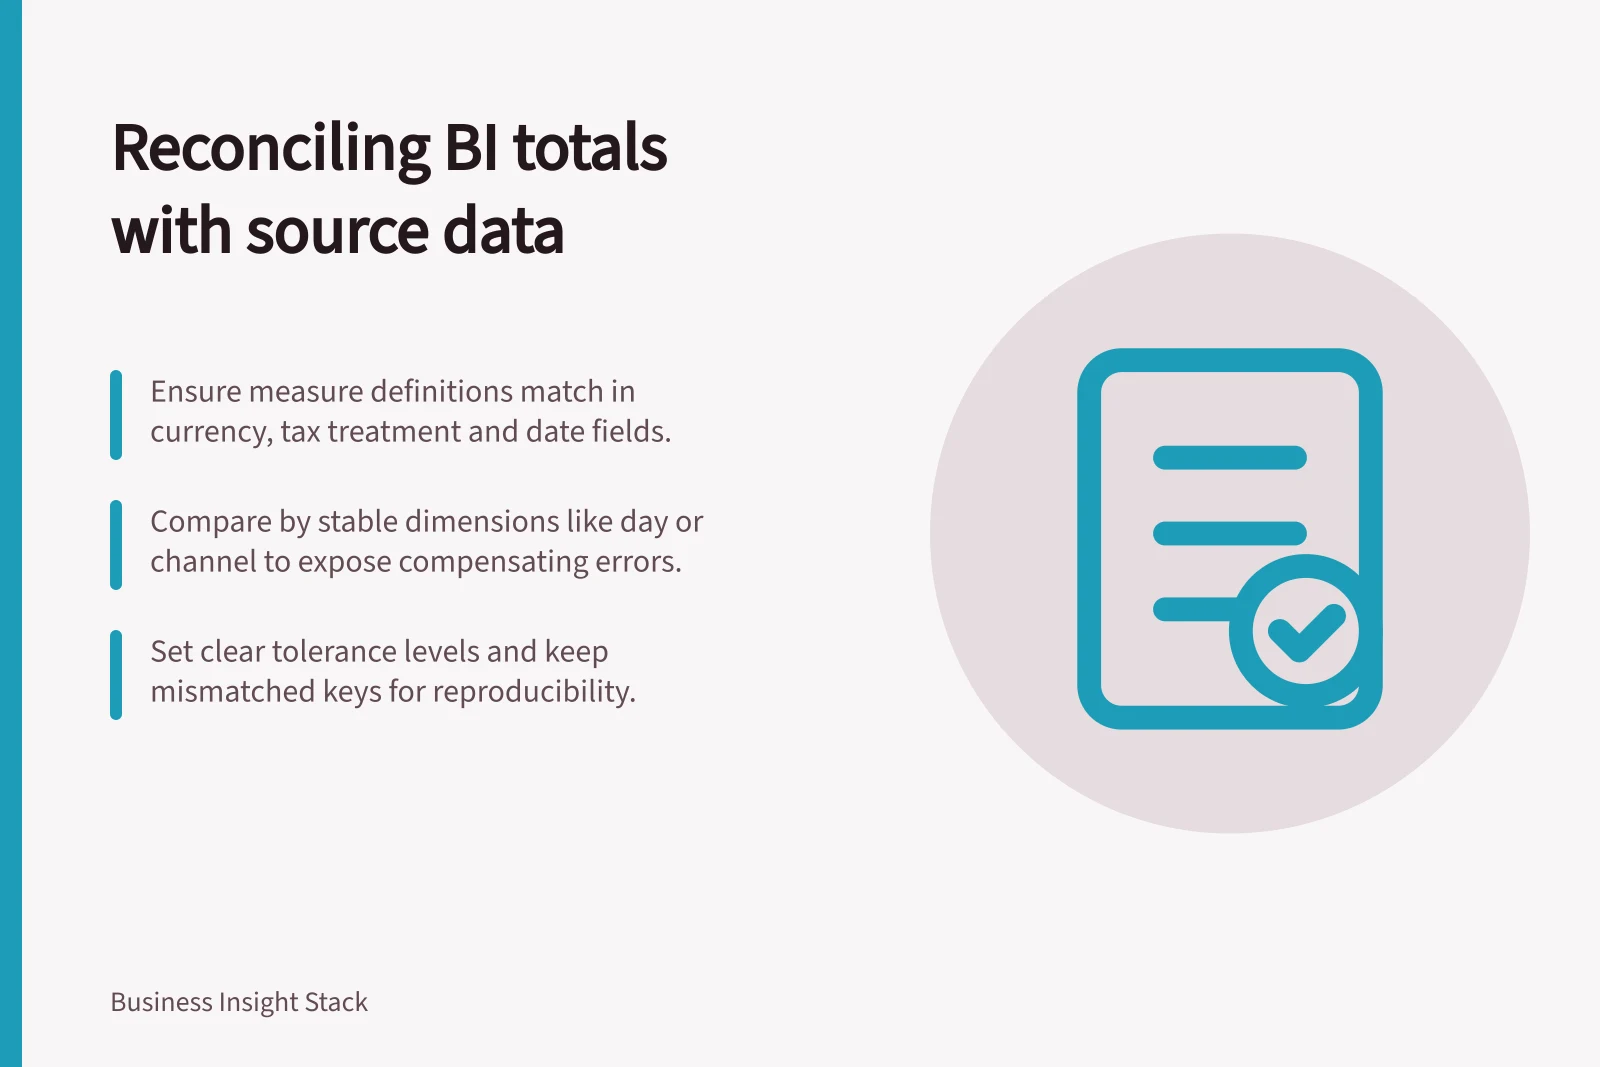
Record the measure definition on each side: gross or net, refunds included or excluded, currency, tax treatment, timezone, date field and status filter. Check the reporting grain. An order total in a header table should not be compared directly with an order-line count.
Choose a closed time window and capture the source extract time and semantic-model refresh time. Imported models can represent a point-in-time copy of the source until refreshed.
Start with a compact control sheet or query containing the source count, model count, source sum, model sum and difference. Use distinct business keys where a join could duplicate rows.
If a total matches only because a missing group offsets a duplicated one, the top-line check has given false comfort. Compare by day, status, channel or another stable dimension to expose compensating errors.
Follow the transformation path
If the difference starts before the model, inspect extraction filters and late-arriving records. If counts diverge after a join, check key cardinality and unmatched rows. If row counts agree but sums differ, inspect type conversion, rounding and metric formula. In a star schema, dimensions filter and group the fact table; an incorrect relationship or filter direction can alter the result shown in a visual.
For a hypothetical example, the source holds 1,000 completed orders for a closed week. The model shows 990 because ten orders arrived after its last refresh. The correct response is to refresh or annotate the reporting cutoff, not to rewrite the sales formula. In another case, a duplicated customer key may multiply some order rows; the total difference should be traced to those joins.
Decide how much difference is acceptable
Some measures should match exactly at a defined precision. Others may have an agreed tolerance because of rounding or timing.
State the tolerance and reason before reviewing results. Never broaden it merely to make a failed comparison pass. Keep the comparison query and a sample of mismatched keys so an owner can reproduce the finding.
Once reconciled, make the check repeatable for a high-value reporting period or refresh cycle. A recurring comparison is most useful when it shows where the difference begins and who is expected to investigate it.
Reconciliation Metrics and Tolerance Thresholds
- Exact Match Required
- Revenue (AUD), GST amount
- Tolerance Justification
- Agreed between data owners and finance teams
- Repeatable Check
- Scheduled monthly for high-value reporting periods