Data Modelling
BI data modelling
Define reporting grain, facts, dimensions, dates, measures and changing attributes in a BI model that produces explainable figures.
BI data modelling gives reporting questions a dependable structure. It defines what each row represents, how records relate, which dates apply and how measures combine. Start with an agreed question and source figure. Build a model that can reproduce and explain it under different filters.
Start with the question and the row
Suppose a manager wants to compare completed orders by month and product. Define completed, the date that assigns an order to a month, and whether records describe orders or order lines. If an order has several lines, joining its header to those lines and summing a repeated order total will overstate the result.
For each table, state its grain: what one row represents. Record the reporting question, available history, date roles, approved measures and known exclusions. A monthly target cannot be broken into daily targets without an agreed allocation rule.
Power BI vs Tableau: Key differences for Australian businesses
- Best for Australian regulatory reporting
- Power BI (with ATO and government data integration)
- Ease of use for non-technical users
- Power BI (native Microsoft ecosystem, strong Excel integration)
- Customisation flexibility
- Tableau (superior visualisation depth, advanced scripting)
- Integration with Australian systems
- Power BI (stronger support for GST, ABN, superannuation data flows)
Separate events from context
In a dimensional model, fact tables hold events or observations; dimension tables supply attributes for grouping and filtering. An order-line fact might hold an order identifier, line identifier, product key, customer key, order-date key, quantity and line amount. Product and customer dimensions might supply descriptive categories. Use the structure that serves the question, not extra tables to make a diagram look like a star.
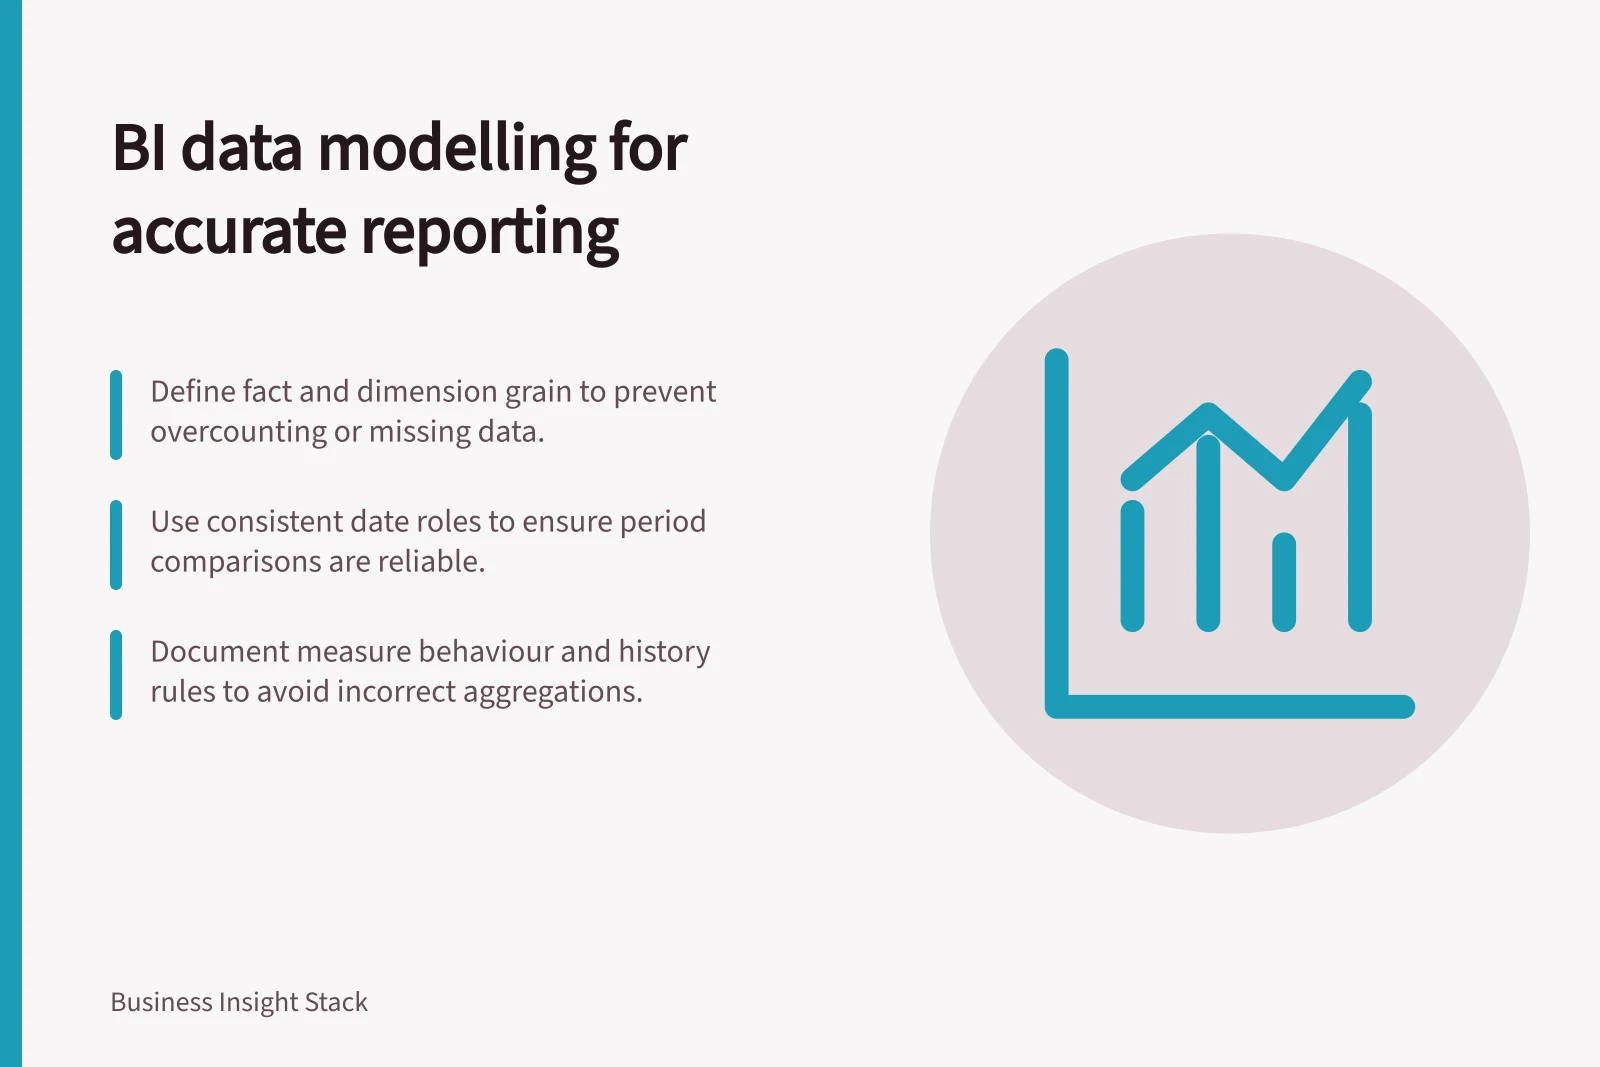
| Design decision | What to record | Why it matters |
|---|---|---|
| Fact grain | What one row records and how to identify it | Prevents repeated or missing contributions to a measure. |
| Dimension grain | What one member or historical version represents | Makes joins and grouping interpretable. |
| Date role | Whether a measure uses order, completion or another date | Keeps period comparisons consistent. |
| Measure behaviour | Which groupings permit a sum and which require another calculation | Prevents balances and rates being added incorrectly. |
| History rule | Whether changed attributes restate the past or retain earlier values | Determines how historical groups appear. |
An end-of-day balance may be combined across comparable accounts on one date. Adding balances across successive dates does not give a meaningful monthly balance. A ratio usually needs recalculating from its underlying values at the requested grouping. Put these rules in the model so report creators need not infer them from column names.
Analytic queries summarise fact measures with functions such as sum, count or average, within dimension filters and groupings. The function and grouping must suit the stored measure. A numeric column alone does not guarantee that adding its values answers the reporting question.
Check relationships and results
In an intended one-to-many relationship, the dimension key must identify one row on the dimension side. If a customer has several historical versions, a customer ID alone does not identify one version. Facts need the appropriate version reference, or the model needs another deliberate way to answer the historical question.
Inspect unmatched keys and unexpected row multiplication after joins. For a fixed period, compare an overall measure and useful breakdowns with an agreed source reference. A plausible grand total can hide errors in individual groups. Record differences caused by population, date choice or reporting cut-off before treating them as defects.
Give dates and changes clear meanings
A shared calendar can provide consistent period labels across reports. Agree on week boundaries, time zone, financial-period labels and treatment of incomplete periods.
If a fact has placed and completed dates, identify which one each measure uses. A calendar may need dates without events so a report can display the full period. An absent event does not prove that an incomplete source load represents zero activity.
Customer region or segment can change. Overwriting a value groups earlier facts by the latest classification. Dated versions can preserve the classification that applied to each event, if facts are matched to the appropriate versions.
Some readers need both views, clearly labelled. If the source retained only current customer values, earlier classifications cannot be recovered from those values alone.
Pros and cons of using a shared calendar in Power BI for Australian reporting
- Pros
- Ensures consistency across departments; aligns with Australian financial and tax periods
- Cons
- May require custom handling for regional time zones (e.g., NSW vs WA)
Meet date-table requirements
Where a source already has a date dimension, Microsoft recommends using it as the source for the model date table. For consistent definitions across models, an organisation can create a Power BI Desktop template with a configured date table and share it with model developers.
Further reading on grain
For detailed guidance on fact keys and grain, see the supporting article on grain.
Release a bounded model
Begin with one reporting slice and a named owner. Document its grain, keys, date roles, measures, history treatment and exclusions. Ask a report creator to reproduce an agreed figure for a fixed period, change a grouping and explain the result.
Repeat affected checks when the model changes: a new customer category can change group totals even when the overall total stays the same. Keep the earlier definition and effective date so readers can distinguish a modelling change from a business change.
In Power BI, Power Query transforms and prepares data before it enters or connects to the semantic model. Microsoft notes that large data volumes or advanced requirements such as slowly changing dimensions can make this challenging. In those cases, it recommends developing a data warehouse and periodic ETL processes first, with the semantic model connecting to that warehouse.
Steps to build a reliable BI data model in Australia
- Define the reporting question with stakeholderse.g., 'Monthly sales by product category for ATO tax reporting'
- Identify the grain: one row = one order lineEnsure no double-counting across orders or time periods
- Assign date roles: order date vs completion dateCritical for accurate month-over-month comparisons
- Document measure behaviour and history rulese.g., whether customer segment changes reclassify past data
- Validate against an agreed source (e.g., accounting system)Check totals and groupings before release
In this guide
- Defining facts, dimensions and reporting grainDefine what each BI table row represents, identify valid keys and distinguish additive amounts from balances and ratios before building reports.
- Building a shared calendar for business reportingSet consistent reporting dates, weeks, financial periods and date roles across BI reports, with practical checks for boundaries and incomplete data.
- Handling changing customer attributes in analytical modelsChoose when to overwrite customer details, retain dated versions or show a current grouping, and check how each choice affects historical BI reports.