Dashboard Design
Part of Business intelligence architecture for growing companies
Dashboards versus business intelligence: defining the scope
See where a dashboard request includes data, definitions and ownership, then write a clear scope for the work.
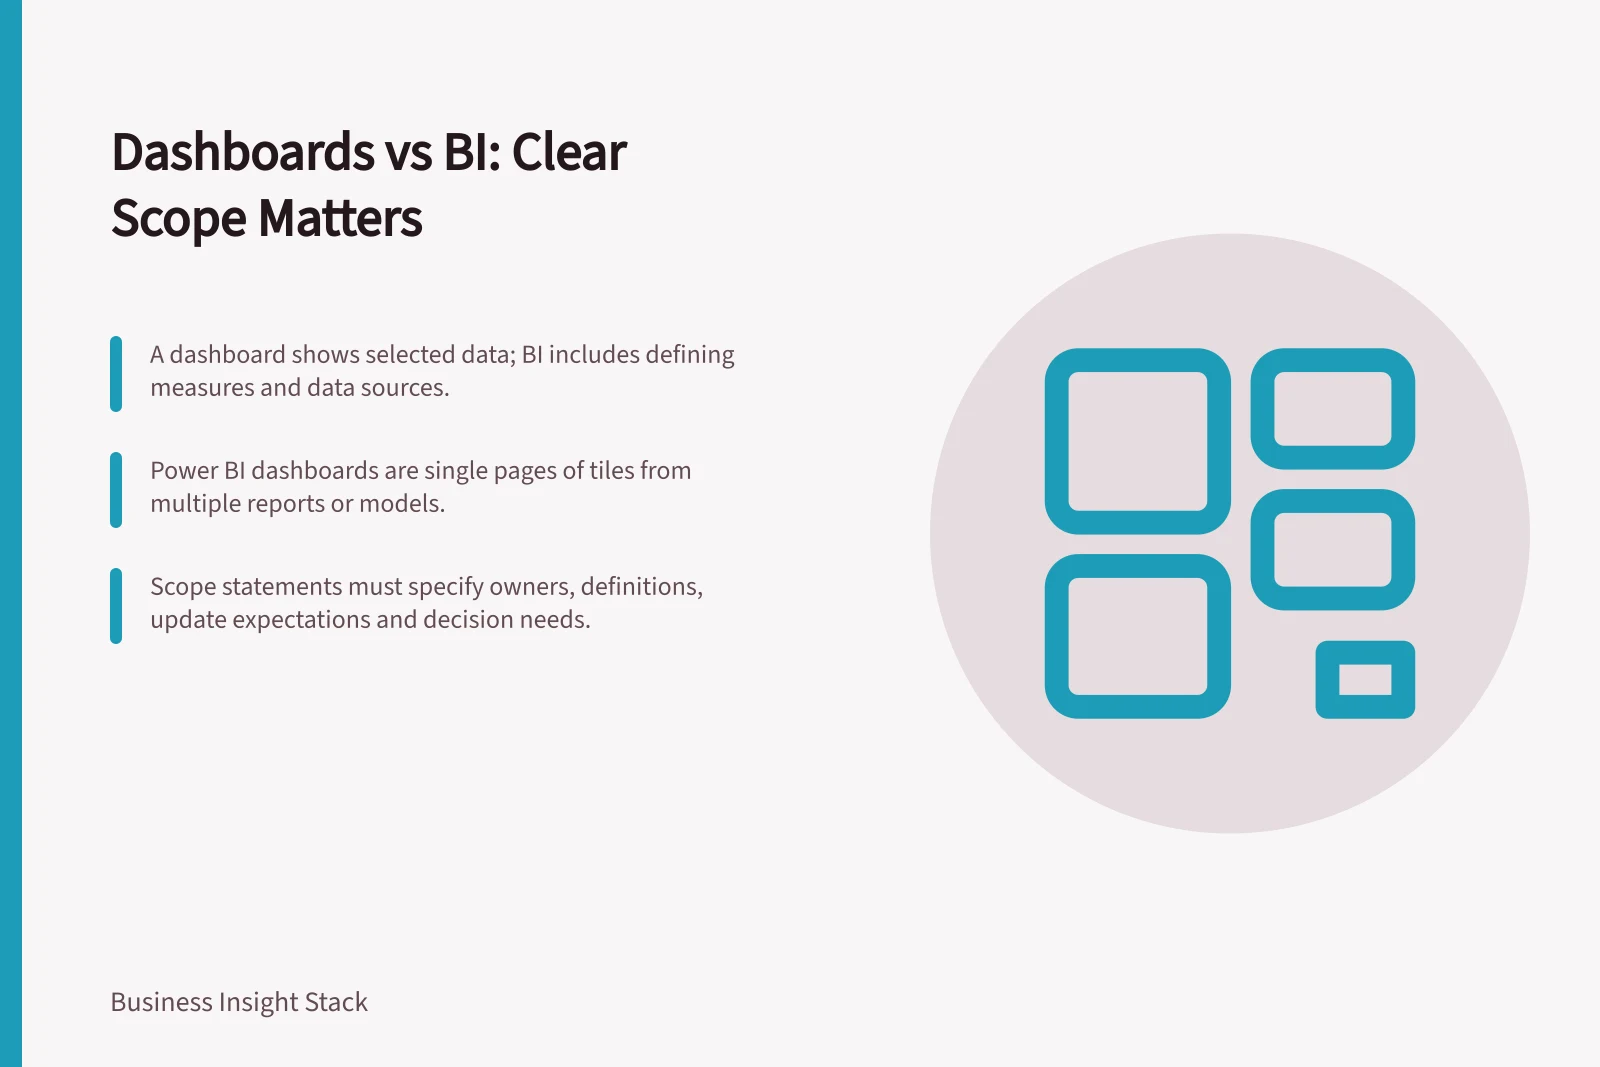
A dashboard presents selected information. Business intelligence (BI) also covers the work that makes it usable: choosing a question, preparing data, agreeing on measures, managing access and maintaining the result. A dashboard request may therefore be a layout task, a data task or both.
Find the work behind the request
Ask what someone needs to decide after seeing the dashboard, then trace the figure they expect to use. Showing monthly orders may be mainly a presentation task if an approved measure and dataset already exist. If teams disagree about whether cancelled orders count, settle the definition first.
| Main need | Immediate work | Question to settle |
|---|---|---|
| A view of established figures | Presentation | Which comparisons and details help the reader act? |
| Agreement on a disputed figure | Definition | Which events, periods and exclusions count? |
| Records from several systems | Data preparation | Which source is authoritative, and how do records match? |
| Reuse across reports | Modelling | Which fields and measures need a common owner? |
| Dependable ongoing use | Support | Who checks updates, changes and access? |
One request can involve several rows. Name the work before estimating it so the visual deliverable does not obscure unresolved data or ownership decisions.
Dashboard vs Business Intelligence: Key Differences in Scope and Work
- DashboardA visual summary of selected metrics; focuses on presentation and layout. In Power BI, it's a single page of tiles drawing from reports or models.
- Business Intelligence (BI)Encompasses the full cycle: defining questions, preparing data, agreeing on measures, managing access, and maintaining systems for reliable insights.
Check what “dashboard” means in the chosen tool
In everyday use, dashboard can mean a compact visual overview. Power BI uses a narrower product definition: a dashboard is a single page of tiles that can draw from more than one report or semantic model. A Power BI report can have multiple pages and provides filtering and slicing that a dashboard does not. These distinctions apply to Power BI, not to every BI tool.
An overview should show the signal, useful context and a route to investigate it. If readers need to inspect segments or explain exceptions, an underlying report may be needed as well. Choose the interface for the decision, rather than relying on its label.
Write a scope statement
Record the intended reader, decision, measures, source systems, reporting period, update expectation and owner. Mark which definitions and datasets are approved and which still need work. A scope statement might read: “The operations lead will review completed cases by week using the approved case-status definition; historical status changes are outside the first release.”
If the work covers only presentation, identify the approved dataset and its owner. If definitions or data movement are included, involve the people responsible for those decisions. At handover, record the measure owner, data cutoff, update responsibility and route for reporting a discrepancy.