Dashboard Design
Part of BI adoption and reporting operations
Measuring whether dashboards are used in decisions
Connect dashboard activity with decision records and reader feedback while accounting for the limits of usage metrics.
Start with a named decision, then look for a trace between the dashboard's information and what the decision maker did next. Views and unique viewers show activity in the routes a usage tool measures. They do not show whether figures were understood, trusted or used to decide.
Define the decision opportunity
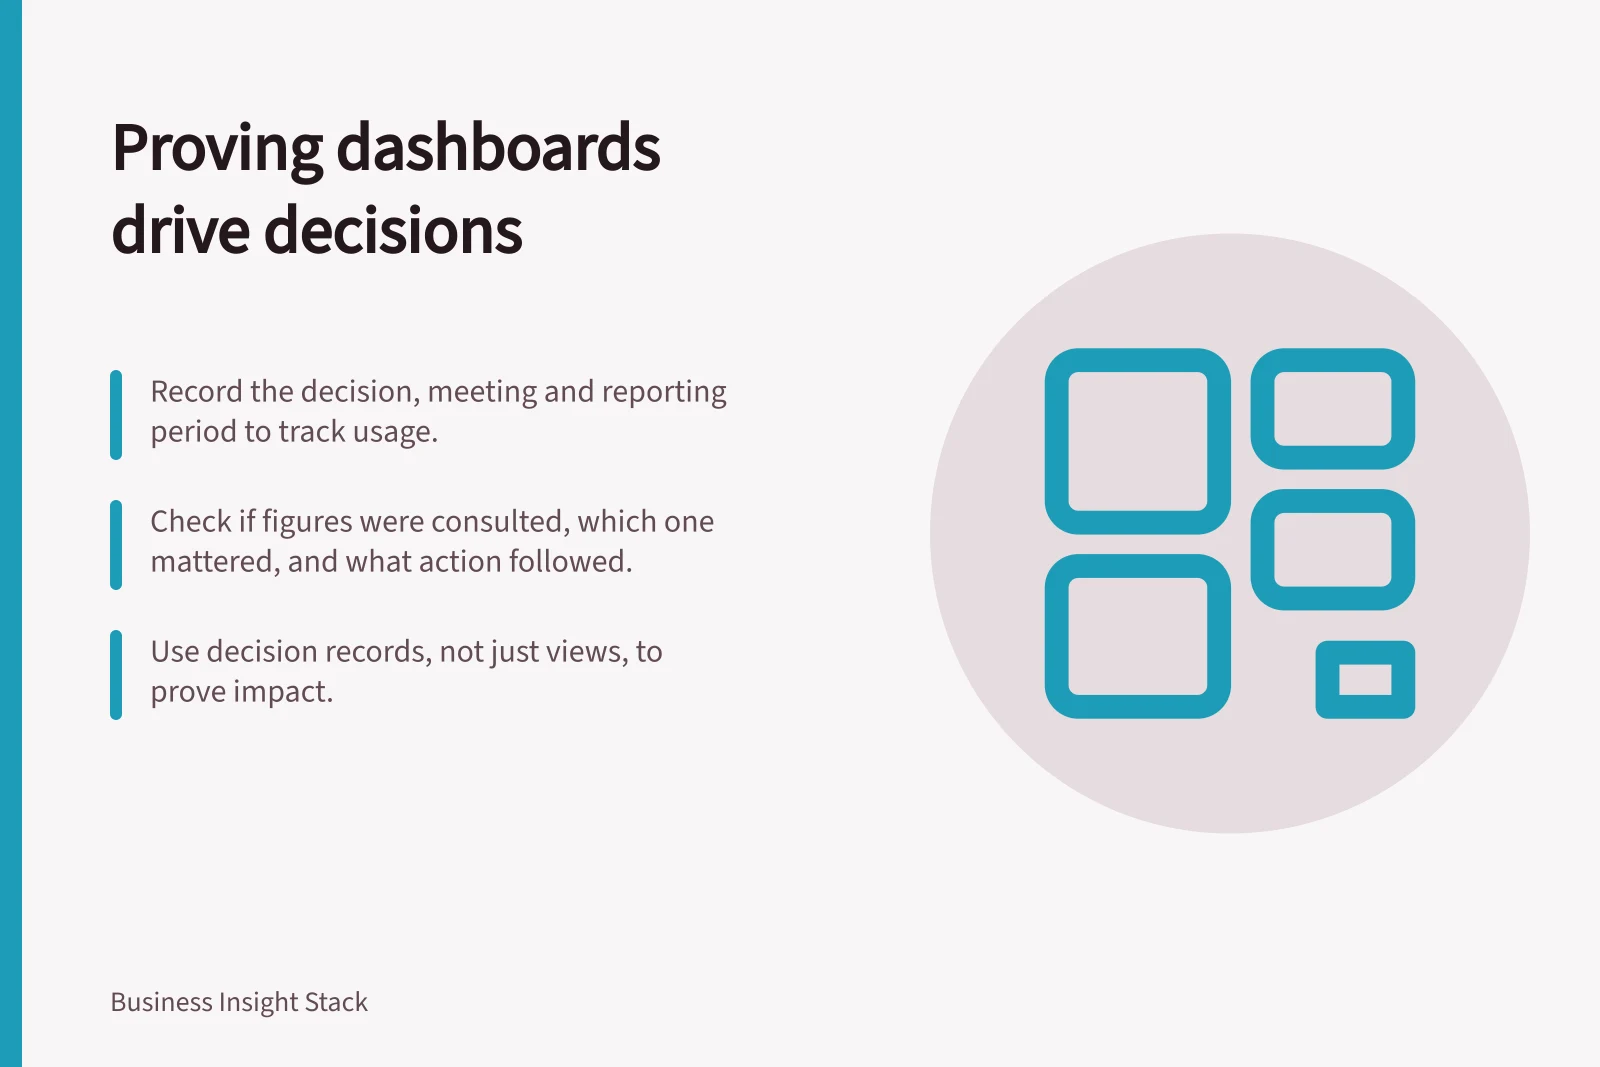
Record the intended reader, decision, meeting or workflow, and reporting period that should be available. At the next opportunity, ask three questions: Was the dashboard consulted? Which figure or exception mattered? What action, request for investigation or deliberate decision to wait followed?
For example, a weekly queue-allocation meeting might record the queue and data cutoff considered, an allocation decision and its follow-up owner. That note would show the dashboard's place in the discussion. It would not prove the dashboard caused a later service improvement.
Combine evidence
| Evidence | What it can show | What it cannot establish alone |
|---|---|---|
| Platform usage | Recorded opens and readers within the tool's coverage | That a figure informed a decision |
| Decision record | Which figure was considered and what was decided | That every reader used the dashboard alike |
| Reader feedback or observation | Whether the output was understandable and timely | Whether its underlying data was accurate |
Choose an observation window that fits the decision. A quarterly risk dashboard should not be judged by daily views. If intended readers do not appear in usage data, ask about access, exports, presentations and embedded delivery before treating the gap as non-use.
Power BI usage metrics track reports embedded in SharePoint Online, but do not track dashboards and reports embedded via the “user owns credentials” or “app owns credentials” flow, or reports embedded via publish to web.
Power BI's improved usage reports for shared workspaces replace the usage metrics reports documented in its older guidance. Identify the report and route in use before comparing counts or interpreting a missing event.
What usage metrics can and cannot establish
- Platform usage
- Recorded opens and readers within the tool's coverage
- Platform usage
- That a figure informed a decision
- Decision record
- Which figure was considered and what was decided
- Decision record
- That every reader used the dashboard alike
- Reader feedback or observation
- Whether the output was understandable and timely
- Reader feedback or observation
- Whether its underlying data was accurate
Power BI usage tracking limitations
- Dashboards embedded via 'user owns credentials' flow
- Not tracked
- Reports embedded via 'app owns credentials' flow
- Not tracked
- Reports embedded via publish to web
- Not tracked
- Embedded in SharePoint Online
- Tracked
Ask what the information changed
After a relevant meeting, ask the decision owner which measure they used, what alternatives they considered and what they still needed. A short note can record the report version or data cutoff, the decision, follow-up owner and review date. If readers repeatedly turn to a spreadsheet for a missing breakdown, that is useful feedback about the dashboard.
Keep the conclusion narrow. A decision recorded beside a dashboard is evidence that it entered that decision. A claim that business results improved because of the dashboard needs separate analysis. A dashboard may also be useful when it helps a team recognise incomplete data and wait.
Act on the finding
Review the evidence with the report owner. Address access or explanation problems, then check the next decision opportunity. Revise scope if the dashboard answers a different question from the one readers need. If no current decision depends on it, begin a purpose review rather than seeking more views for their own sake.