BI Architecture
Part of Analytical forecasting
Choosing a baseline before adding a complex model
Compare mean, latest-value, seasonal and drift baselines, then decide whether a more complex forecasting model adds useful value.
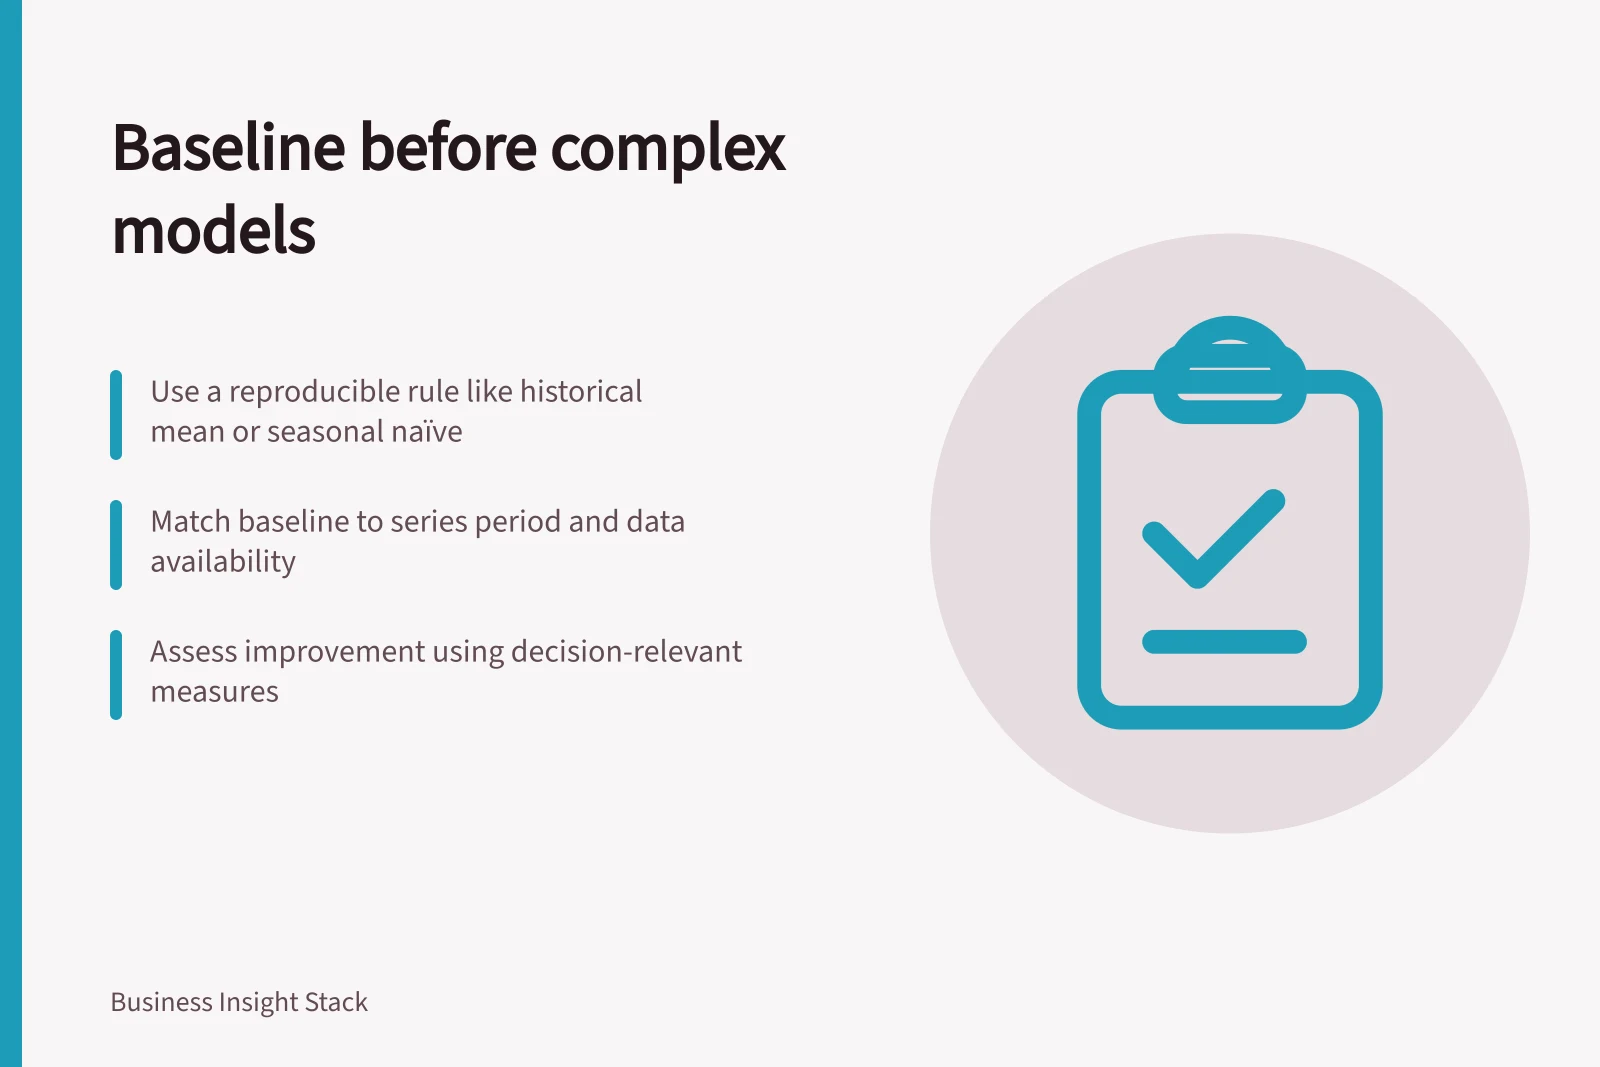
Choose a baseline that a colleague can reproduce for the same forecast task as the proposed model. It shows what a simple rule can predict. Add complexity when a more involved method improves the relevant decision on comparable earlier periods and can still be run when the next forecast is due.
Evaluating a Complex Model Against a Baseline
- Choose a reproducible baselineEnsure a colleague can replicate the forecast task using the same data and rules
- Match the rule to the seriesSelect a baseline appropriate to the time series pattern (e.g., daily with day-of-week, monthly with annual cycle)
- Align the baseline to the decisionForecast the same target measure (e.g., four-week total) as the business decision requires
- Define what improvement mattersUse appropriate error measures (MAE, RMSE) and assess decisions, not just aggregate scores
- Keep the comparison availableContinue calculating the baseline even after adopting a complex model
Match the rule to the series
| Candidate baseline | Rule | Check before using it |
|---|---|---|
| Historical mean | Use the average of eligible observations. | Is older history still relevant to the current process? |
| Latest observation | Repeat the last observed value. | Does this miss a recurring seasonal pattern? |
| Seasonal naïve | Repeat the latest observation from the same season. | Is there comparable seasonal history? |
| Drift | Extend the average change between the first and last observations. | Could a temporary change make that slope misleading? |
These are candidates, not a ranking. A daily series with a day-of-week pattern and a monthly series with an annual cycle require different seasonal definitions. Write down the period, source cutoff and observation each rule uses. A “last month” baseline is unsuitable if that month is incomplete.
Baseline Forecasting Methods: Rules and Use Cases
- Historical Mean
- Average of eligible observations
- Latest Observation
- Repeat the last observed value
- Seasonal Naïve
- Repeat the latest observation from the same season
- Drift
- Extend the average change between first and last observations
Pre-Use Checks for Baseline Methods
- Is older history still relevant to the current process?For Historical Mean
- Does this miss a recurring seasonal pattern?For Latest Observation
- Is there comparable seasonal history?For Seasonal Naïve
- Could a temporary change make that slope misleading?For Drift
Match the baseline to the decision
Suppose a manager needs the next four weekly totals. At each historical issue date, produce a prediction for each of those four weeks. If the decision concerns their combined workload, assess the four-week total as well. Keep the target measure, treatment of cancellations and reporting calendar the same for every candidate.
Use only information that would have existed at each issue date. If a high week was corrected later, decide whether the exercise reproduces the data available then or uses a consistently restated history, and document the choice. Give the baseline and challenger equivalent access to information available at the time.
Define what improvement would matter
Choose error measures and decision criteria before comparing results. Mean absolute error expresses the average miss in the series’ units; root mean squared error gives larger misses more weight. Percentage error can be undefined or unstable when actuals are zero or close to zero. Inspect the periods that matter instead of relying on one aggregate score.
Then examine what the challenger needs to run. A model using a promotion calendar can make an advance forecast if the relevant schedule is available at issue time. A historical evaluation using later-observed activity answers a different question. If future predictors must be forecast, account for that work and for uncertainty their estimates introduce.
Key Error Measures for Forecast Evaluation
- Mean Absolute Error (MAE)
- Average absolute difference in original units
- Root Mean Squared Error (RMSE)
- Gives more weight to larger errors
- Percentage Error
- Can be undefined or unstable when actuals are near zero
Keep the comparison available
If the challenger is adopted, continue to calculate the baseline. Demand, data definitions and input availability may change, removing the challenger’s earlier advantage. Keep the rule, issue dates and outcomes so the comparison can be repeated. A simple method remains a defensible choice when added complexity has not shown enough decision value to justify its operating cost, provided its limits are clear.