Metric Definitions
Part of Executive dashboard design
Choosing a small set of decision-relevant indicators
Select dashboard indicators by the decisions leaders actually make.
Start with recurring decisions leaders make, then choose the smallest set of measurable signals that can change what they do. A useful indicator points to a named action, investigation or trade-off; use a detailed report for diagnosis.
Work backwards from a meeting decision
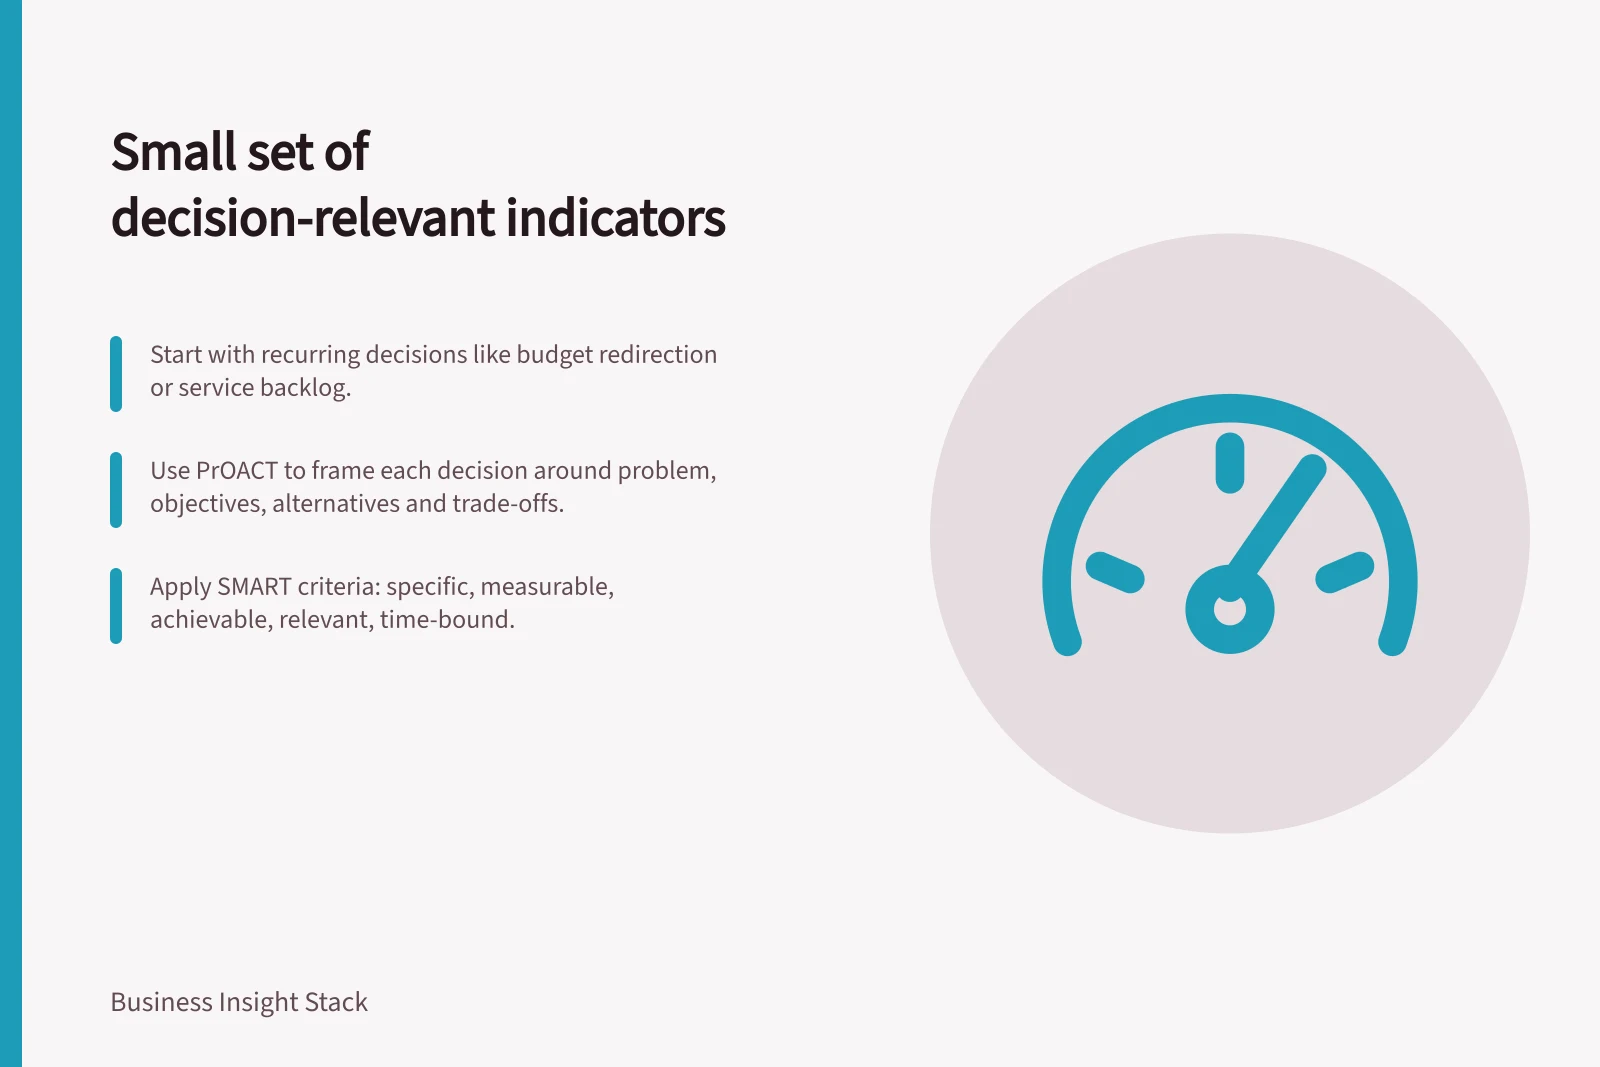
List recurring choices such as redirecting budget, addressing a service backlog, changing capacity or investigating customer loss. Frame each decision around its problem, objectives, alternatives, consequences and trade-offs—the PrOACT approach—before choosing measures.
A candidate shortlist for those decisions could include revenue, service backlog and customer loss. For revenue, price, volume and product mix are possible drivers; include them when they help explain a change and affect the response.
For a budget-redirection decision, track revenue over a defined period and investigate price, volume or product mix when it changes. The leader making the budget decision owns the action; assign an owner who can explain the measure and its movement.
Apply SMART to each candidate: specific (quantity, quality, location and target population), measurable (assessable accurately), achievable (given budget, time and resources), relevant (tracks the intended change) and time-bound (has a deadline). Also name the action, investigation or trade-off a meaningful change would prompt.
Choose the minimum number needed to report progress towards each objective or result. This is often one indicator, and usually no more than two or three per objective or result.
Check how indicators relate as a set, not only one by one. Mapping their causal links can help identify the relevant measures for a particular problem and make the set more transparent and efficient.
Define each measure’s time period, numerator, denominator and refresh frequency. Two teams may use “active customer” differently, so settle the definition before giving it prominence.
Treat an indicator as a signal or proxy, not the outcome itself. A change can prompt questions about what is changing, why, who is affected and what action, if any, should follow.
Power BI guidance treats a dashboard as a concise overview of current data, with detail in underlying reports and semantic models. Show the signal leaders need to monitor and provide a route to diagnosis rather than putting every detail on the dashboard.
Review the set after several decisions. If an indicator draws no discussion or action, check whether its audience, definition or placement needs attention.
Indicator best practice summary
- Indicator ownership requirement
- Must have an accountable owner
- Definition consistency
- Standardise terms like 'active customer'
- Dashboard purpose
- Signal-focused overview with access to detailed diagnosis