Dashboard Design
Part of Analytical forecasting
Explaining forecast ranges to business stakeholders
Explain prediction intervals, scenarios and planning allowances in plain language, with assumptions and decisions beside the range.
Explain a forecast range by naming the future outcome, period, method behind the range and decision it informs. State whether readers are seeing a statistical prediction interval, outcomes under different scenarios or an operational planning allowance. These have different meanings.
Understanding Forecast Range Types: Prediction Intervals vs. Scenarios vs. Planning Allowances
- ScenariosOutcomes under different assumed future conditions (e.g., promotion, extended hours). Not probabilistic; may reflect low-probability extremes.
- Planning AllowanceManagement’s buffer above the central forecast for risk mitigation (e.g., extra staffing). Not part of the forecast itself.
Explain what the endpoints mean
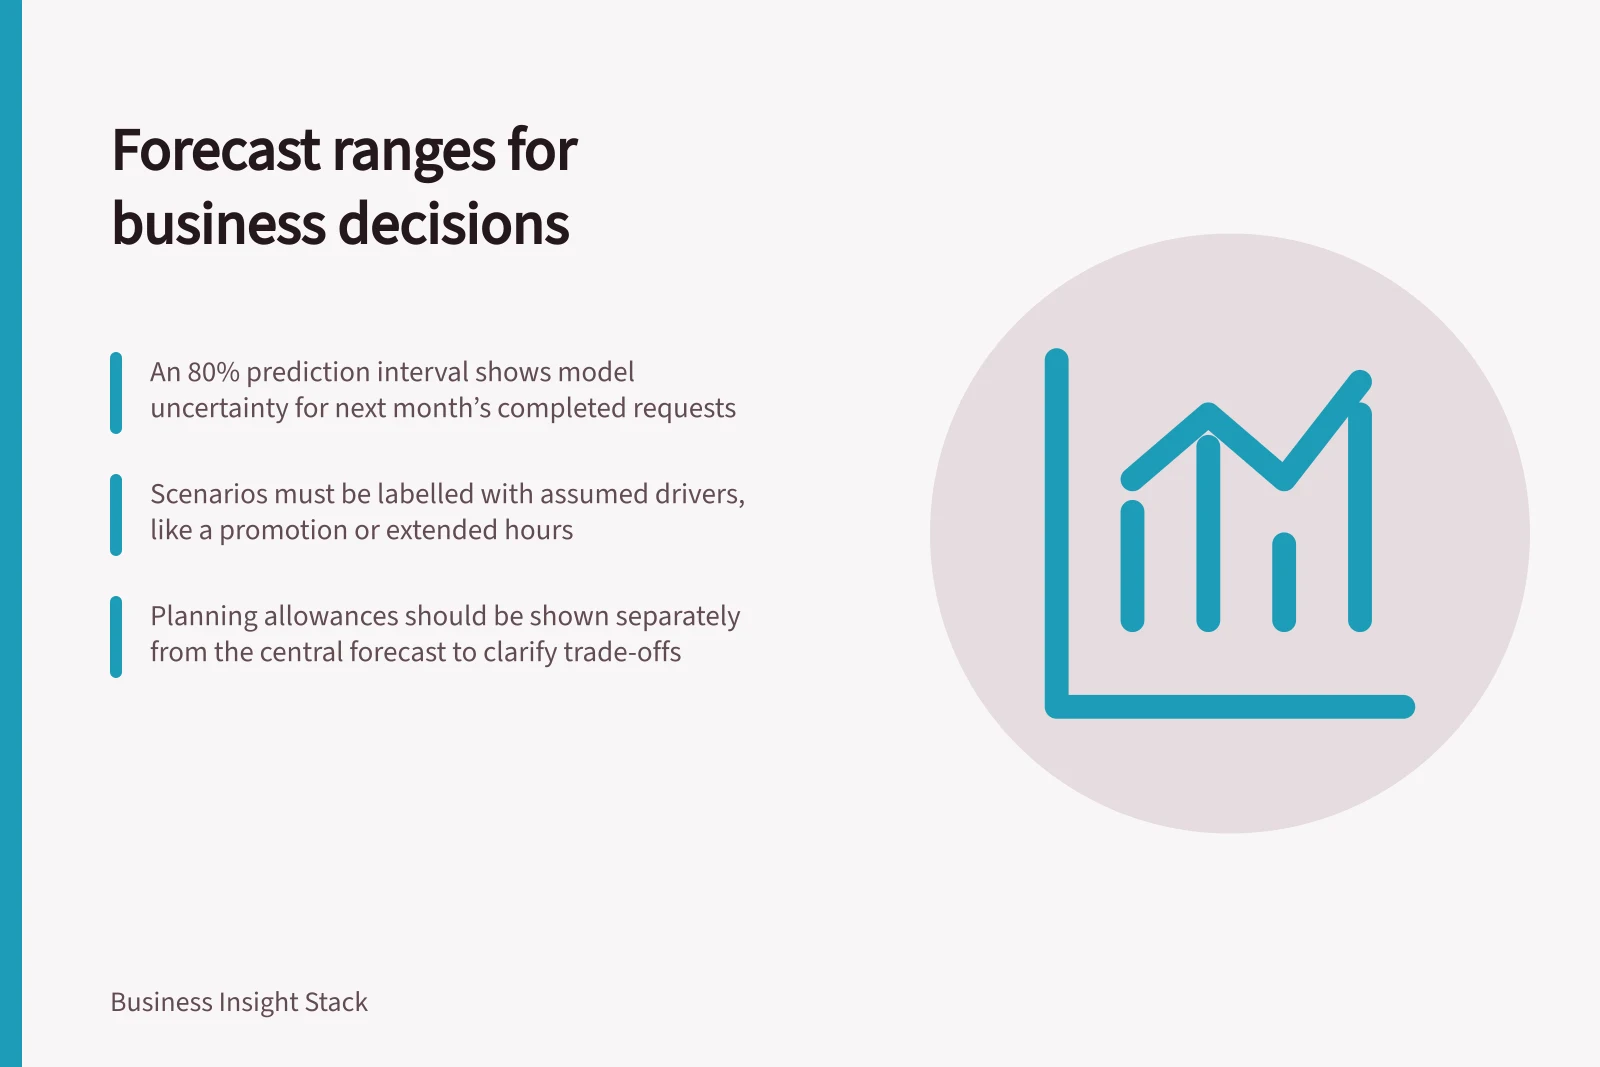
For a model-based prediction interval, state its coverage level and the future outcome it concerns. An 80% prediction interval for next month's total completed requests describes uncertainty around that monthly total under the model and its assumptions.
It does not guarantee that the total will fall inside the displayed range. Nor does it mean that 80% of individual requests will fall between its endpoints.
Show the unit, date boundary and source cutoff beside the range. If the upper end affects staffing, state whether the estimate covers every team or only those with complete data. Use no more precision than the decision needs.
Key Elements to Include When Explaining a Forecast Range
- Future Outcome
- e.g., total completed requests
- Time Period
- e.g., next month
- Unit & Source
- e.g., requests, ATO data feed
Keep scenarios separate
Low- and high-demand scenarios describe outcomes under different assumptions about a future driver, such as a promotion or opening hours. Label the driver and assumed value for each scenario.
Their endpoints are not automatically probability bounds. A plausible extreme scenario may have a low chance of occurring.
If a regression forecast holds uncertain future predictors at assumed values, its reported prediction interval may omit uncertainty in those values. State that limit next to the figures.
A planning allowance is a further choice: management may staff above the central forecast because a shortage would be costly. That higher staffing level does not become the forecast. Display the estimate and chosen planning level separately so the trade-off is visible.
Connect the range to a decision
Ask what would change if the outcome approached the lower or upper end. A briefing could say that the operations lead will review an extra-shift option if demand approaches the upper end. That is an illustrative decision rule; it says nothing about the adequacy of a real roster.
Use a range for the horizon being decided. Uncertainty for next week and next quarter need not be the same; prediction intervals commonly widen further ahead, subject to the model.
If a chart has bands for several periods, label whether each band concerns one period or a cumulative total. A range for one month does not describe a whole quarter.
Check the explanation over time
After outcomes arrive, compare them with the ranges that were issued. Repeated misses on one side or unusual changes in width may warrant investigation. Conditions may change, so keep the issue date, assumptions and earlier versions with the result.
Before using a range in a decision, ask a reader to explain what its endpoints mean and what action they affect. If they take the upper bound as a target, the lower bound as a guaranteed minimum or scenario values as probabilities, improve the labels and accompanying explanation.