Reporting Operations
Analytical forecasting
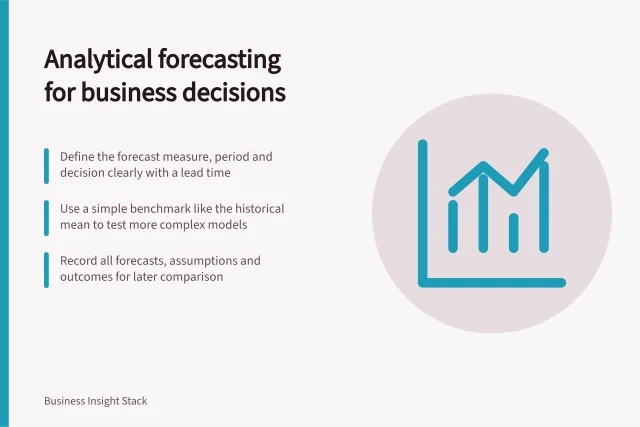
Define a business forecast, compare methods with a simple benchmark, assess earlier predictions and communicate uncertainty before using the result.

Desk
Covers dashboard design, self-service access and how analysts answer recurring business questions.
Reporting Operations
Define a business forecast, compare methods with a simple benchmark, assess earlier predictions and communicate uncertainty before using the result.
Reporting Operations
Assign a business owner and technical contact to a recurring report, then record the decisions and handover each role requires.
Reporting Operations
Keep BI reports useful with clear owners, evidence of decision use, timely reviews and controlled retirement.
Reporting Operations
Use BI to review operational demand, completed work, backlog, delays and capacity, with clear definitions and limits for each decision.
Dashboard Design
Turn incoming work and backlog goals into effort, compare them with usable hours and slots, and show the assumptions behind a capacity gap.
BI Architecture
Plan BI architecture around decisions, source data, shared measures, reporting, access and change without overbuilding the first solution.
Reporting Operations
Verify BI exports and embedded reports with the users, permissions, file contents and authentication your delivery route requires.
Dashboard Design
Compare who builds reports, owns shared measures and approves distribution when selecting a BI reporting model.
Dashboard Design
See where a dashboard request includes data, definitions and ownership, then write a clear scope for the work.
Dashboard Design
An exception tile should tell a leader what changed, whether the data is trustworthy and who is investigating.
Dashboard Design
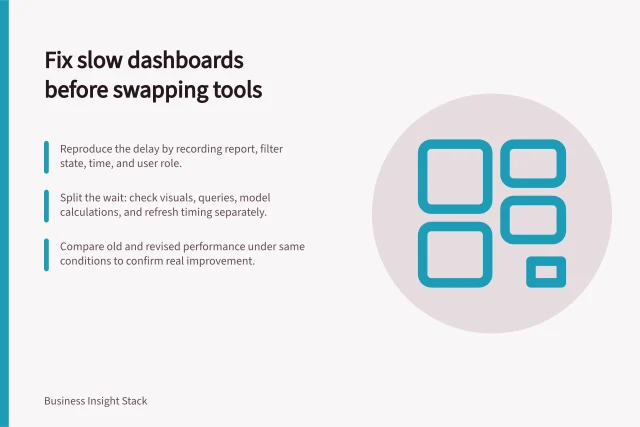
Reproduce a slow dashboard action, locate the delay, and test whether a targeted fix meets the reader’s need before considering replacement.
Dashboard Design
An executive dashboard should make a small number of decisions easier, not display everything the organisation can measure.
Dashboard Design
Explain prediction intervals, scenarios and planning allowances in plain language, with assumptions and decisions beside the range.
Dashboard Design
Structure finance BI views around approved figures, comparable periods, explainable variances and visible reporting limits.
Dashboard Design
Connect dashboard activity with decision records and reader feedback while accounting for the limits of usage metrics.
Reporting Operations
Compare BI entitlements and scheduled jobs with actual tasks, telemetry coverage and dependencies before changing access or schedules.
Reporting Operations
Find repeated report queries, reduce unnecessary reads and runs, and verify the result under the relevant billing model.
Dashboard Design
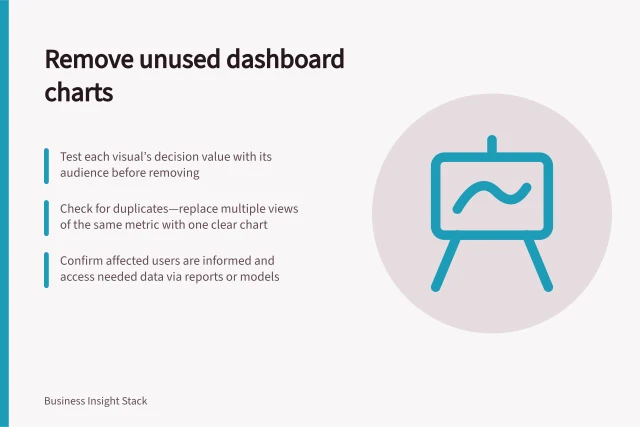
Removing a chart can make an executive dashboard more useful.
Reporting Operations
Investigate an unexplained report's meaning, users and dependencies before documenting, replacing or retiring it.
Reporting Operations
Set a release trigger, check figures and access, and record a version-specific decision before a self-service report reaches more people.
Reporting Operations
Schedule affected report reviews after restructures, departures and audience changes before the next important use.
Dashboard Design
Learn how to give teams room to create reports while maintaining dependable datasets, useful training and proportionate review.
Dashboard Design
A target helps only when the viewer can tell what it represents and how certain the comparison is.
Reporting Operations
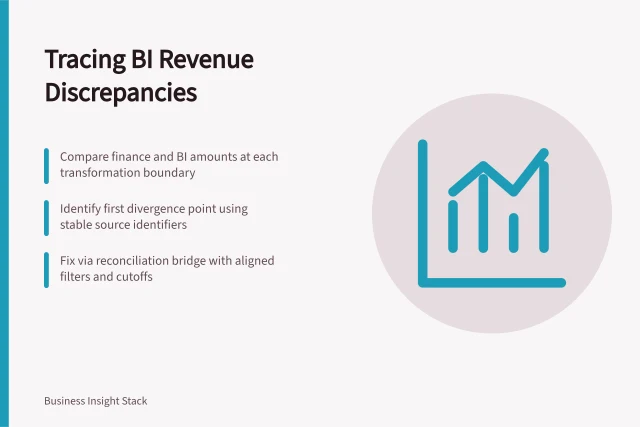
Find where a BI revenue difference begins by comparing an approved finance amount and contributing records at each transformation boundary.